mkfifo ifstat_fifo
ifstat -n > ifstat_fifo
Then, in another terminal, open an R shell and do the following:
# Plot the most recent 100 seconds of inbound network traffic
> while(T){
  d <- read.table(fifo("ifstat_fifo",open="read"))
  x <- rbind(x,d)
  x <-tail(x,100)
  plot(x$V1,type='l')
  Sys.sleep(1)
}
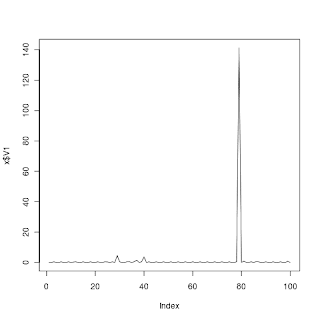
You may have to run it a couple times while the fifo fills with data. And here's what that looks like:

Thanks for this post. However, I don't know what x is in your example. Also, I couldn't get the read.table(...) function to work but was able to use readLines(...). I'm new to R, so do you mind expanding on this post?
ReplyDeleteThanks!
Nice blog has been shared by you. it will be really helpful to many peoples who are all working under the technology.thank you for sharing this blog.
ReplyDeleteR Programming Online Training|
SAS Online Training |
Tableau Online Training|
nice blog
ReplyDeletedata science training in bangalore
hadoop training in bangalore
uipath training in bangalore
python online training
python training in bangalore | python online training
ReplyDeleteaws training in Bangalore | aws online training
machine learning training in bangalore | machine learning online training
artificial intelligence training in bangalore | artificial intelligence online training
data science training in bangalore | data science online training