Degree Distribution
Since the point here is to illustrate the difference between the wukong way and the pig way we're not going to introduce anything clever here. Here's the code for calculating the degree by month (both passengers and flights) for every domestic airport since 1990:
--
-- Caculates the monthly degree distributions for domestic airports from 1990 to 2009.
--
-- Load data (boring part)
flight_edges = LOAD '$FLIGHT_EDGES' AS (origin_code:chararray, destin_code:chararray, passengers:int, flights:int, month:int);

-- For every (airport,month) pair get passengers, seats, and flights out
edges_out     = FOREACH flight_edges GENERATE
                  origin_code AS airport,
                  month       AS month,
                  passengers  AS passengers_out,
                  flights     AS flights_out
                ;

-- For every (airport,month) pair get passengers, seats, and flights in
edges_in      = FOREACH flight_edges GENERATE
                  destin_code AS airport,
                  month       AS month,
                  passengers  AS passengers_in,
                  flights     AS flights_in
                ;

-- group them together and sum
grouped_edges = COGROUP edges_in BY (airport,month), edges_out BY (airport,month);
degree_dist   = FOREACH grouped_edges {
                  passenger_degree = SUM(edges_in.passengers_in) + SUM(edges_out.passengers_out);
                  flights_degree   = SUM(edges_in.flights_in)    + SUM(edges_out.flights_out);
                  GENERATE
                    FLATTEN(group)   AS (airport, month),
                    passenger_degree AS passenger_degree,
                    flights_degree   AS flights_degree
                  ;
                };

STORE degree_dist INTO '$DEG_DIST';
So, here's what's going on:
- FOREACH..GENERATE: this is called a 'projection' in pig. Here we're really just cutting out the fields we don't want and rearranging our records. This is exactly the same as what we do in the wukong script, where we yielded two different types of records for the same input data in the map phase, only a lot more clear.
- COGROUP: here we're simply joining our two data relations together (edges in and edges out) by a common key (airport code,month) and aggregating the values for that key. This is exactly the same as what we do in the 'accumulate' part of the wukong script.
- FOREACH..GENERATE (once more): here we run through our grouped records and sum the flights and passengers. This is exactly the same as the 'finalize' part of the wukong script.
So, basically, we've done in 4 lines (not counting the LOAD and STORE or the prettification) of very clear and concise code what took us ~70 lines of ruby. Win.
Here's the wukong one again for reference:
#!/usr/bin/env ruby

require 'rubygems'
require 'wukong'

class EdgeMapper < Wukong::Streamer::RecordStreamer
  #
  # Yield both ways so we can sum (passengers in + passengers out) and (flights
  # in + flights out) individually in the reduce phase.
  #
  def process origin_code, destin_code, passengers, flights, month
    yield [origin_code, month, "OUT", passengers, flights]
    yield [destin_code, month, "IN", passengers, flights]
  end
end

class DegreeCalculator < Wukong::Streamer::AccumulatingReducer
  #
  # What are we going to use as a key internally?
  #
  def get_key airport, month, in_or_out, passengers, flights
    [airport, month]
  end

  def start! airport, month, in_or_out, passengers, flights
    @out_degree = {:passengers => 0, :flights => 0}
    @in_degree  = {:passengers => 0, :flights => 0}
  end

  def accumulate airport, month, in_or_out, passengers, flights
    case in_or_out
    when "IN" then
      @in_degree[:passengers] += passengers.to_i
      @in_degree[:flights]    += flights.to_i
    when "OUT" then
      @out_degree[:passengers] += passengers.to_i
      @out_degree[:flights]    += flights.to_i
    end
  end

  #
  # For every airport and month, calculate passenger and flight degrees
  #
  def finalize

    # Passenger degrees (out, in, and total)
    passengers_out   = @out_degree[:passengers]
    passengers_in    = @in_degree[:passengers]
    passengers_total = passengers_in + passengers_out

    # Flight degrees (out, in, and total)
    flights_out      = @out_degree[:flights]
    flights_in       = @in_degree[:flights]
    flights_total    = flights_in + flights_out

    yield [key, passengers_in, passengers_out, passengers_total, flights_in, flights_out, flights_total]
  end
end

#
# Need to use 2 fields for partition so every record with the same airport and
# month land on the same reducer
#
Wukong::Script.new(
  EdgeMapper,
  DegreeCalculator,
  :partition_fields  => 2 # use two fields to partition records
  ).run
Plot Data
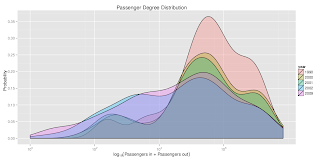
A very common workflow pattern with Hadoop is to use a tool like pig or wukong to process large scale data and generate some result data set. The last step in this process is (rather obviously) to summarize that data in some way. Here's a quick plot (using R and ggplot2) of the flights degree distribution after I further summarized by year:

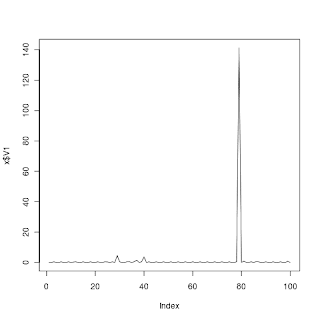
That's funny...
Finally, here's the code for the plot:
# include the ggplot2 library for nice plots
library(ggplot2);

# Read data in and take a subset
degrees        <- read.table('yearly_degrees.tsv', header=FALSE, sep='\t', colClasses=c('character', 'character', 'numeric', 'numeric'));
names(degrees) <- c('airport_code', 'year', 'passenger_degree', 'flights_degree');
select_degrees <- subset(degrees, year=='2000' | year=='2001' | year=='2002' | year=='2009' | year=='1990');

# Plotting with ggplot2
pdf('passenger_degrees.pdf', 12, 6, pointsize=10);
ggplot(select_degrees, aes(x=passenger_degree, fill=year)) + geom_density(colour='black', alpha=0.3) + scale_x_log10() + ylab('Probability') + xlab(expression(log[10] ('Passengers in + Passengers out'))) + opts(title='Passenger Degree Distribution')
Hurray.

